Inspect page evidence and consent behavior
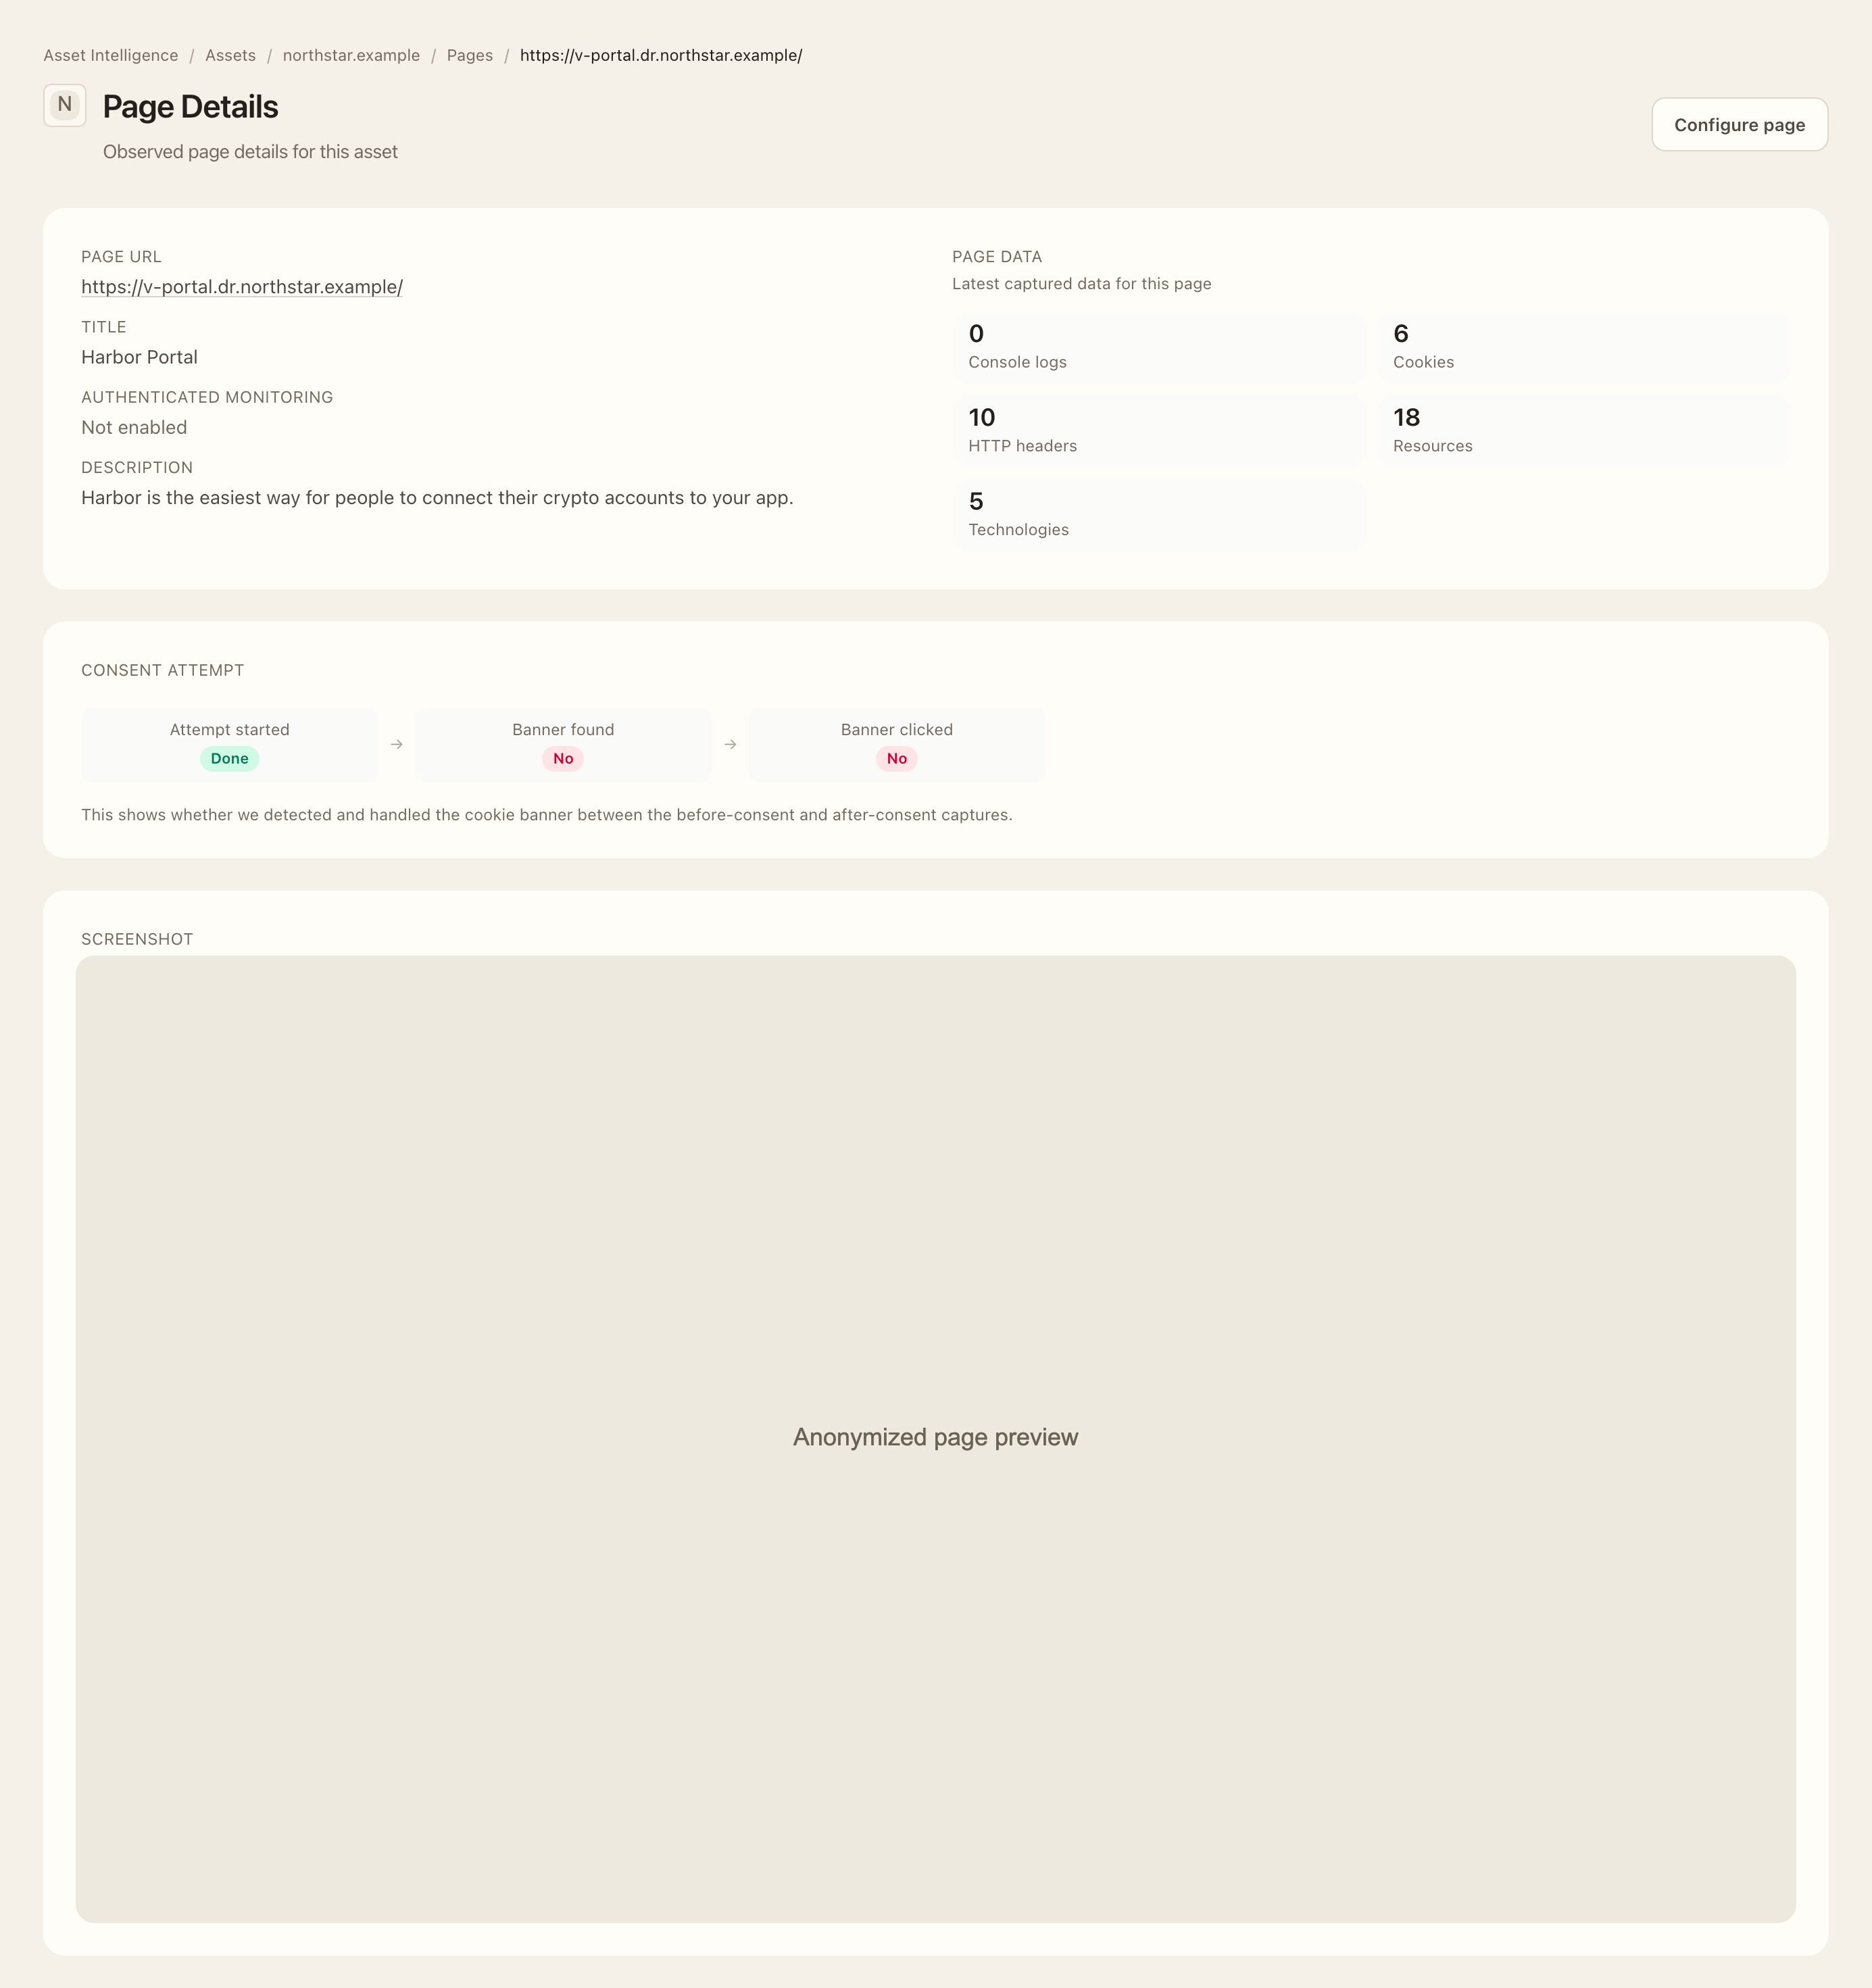
Start from the exact page
- Open an asset, choose Pages, and select the intended target, port, and path.
- Review its latest observation, redirect, and monitoring-coverage state.
- Inspect Consent Attempt to see whether a banner was found and an interaction was attempted or completed.
- Use the related evidence pages below, checking observation times and before/after-consent phases where available.
Inspect HTTP headers
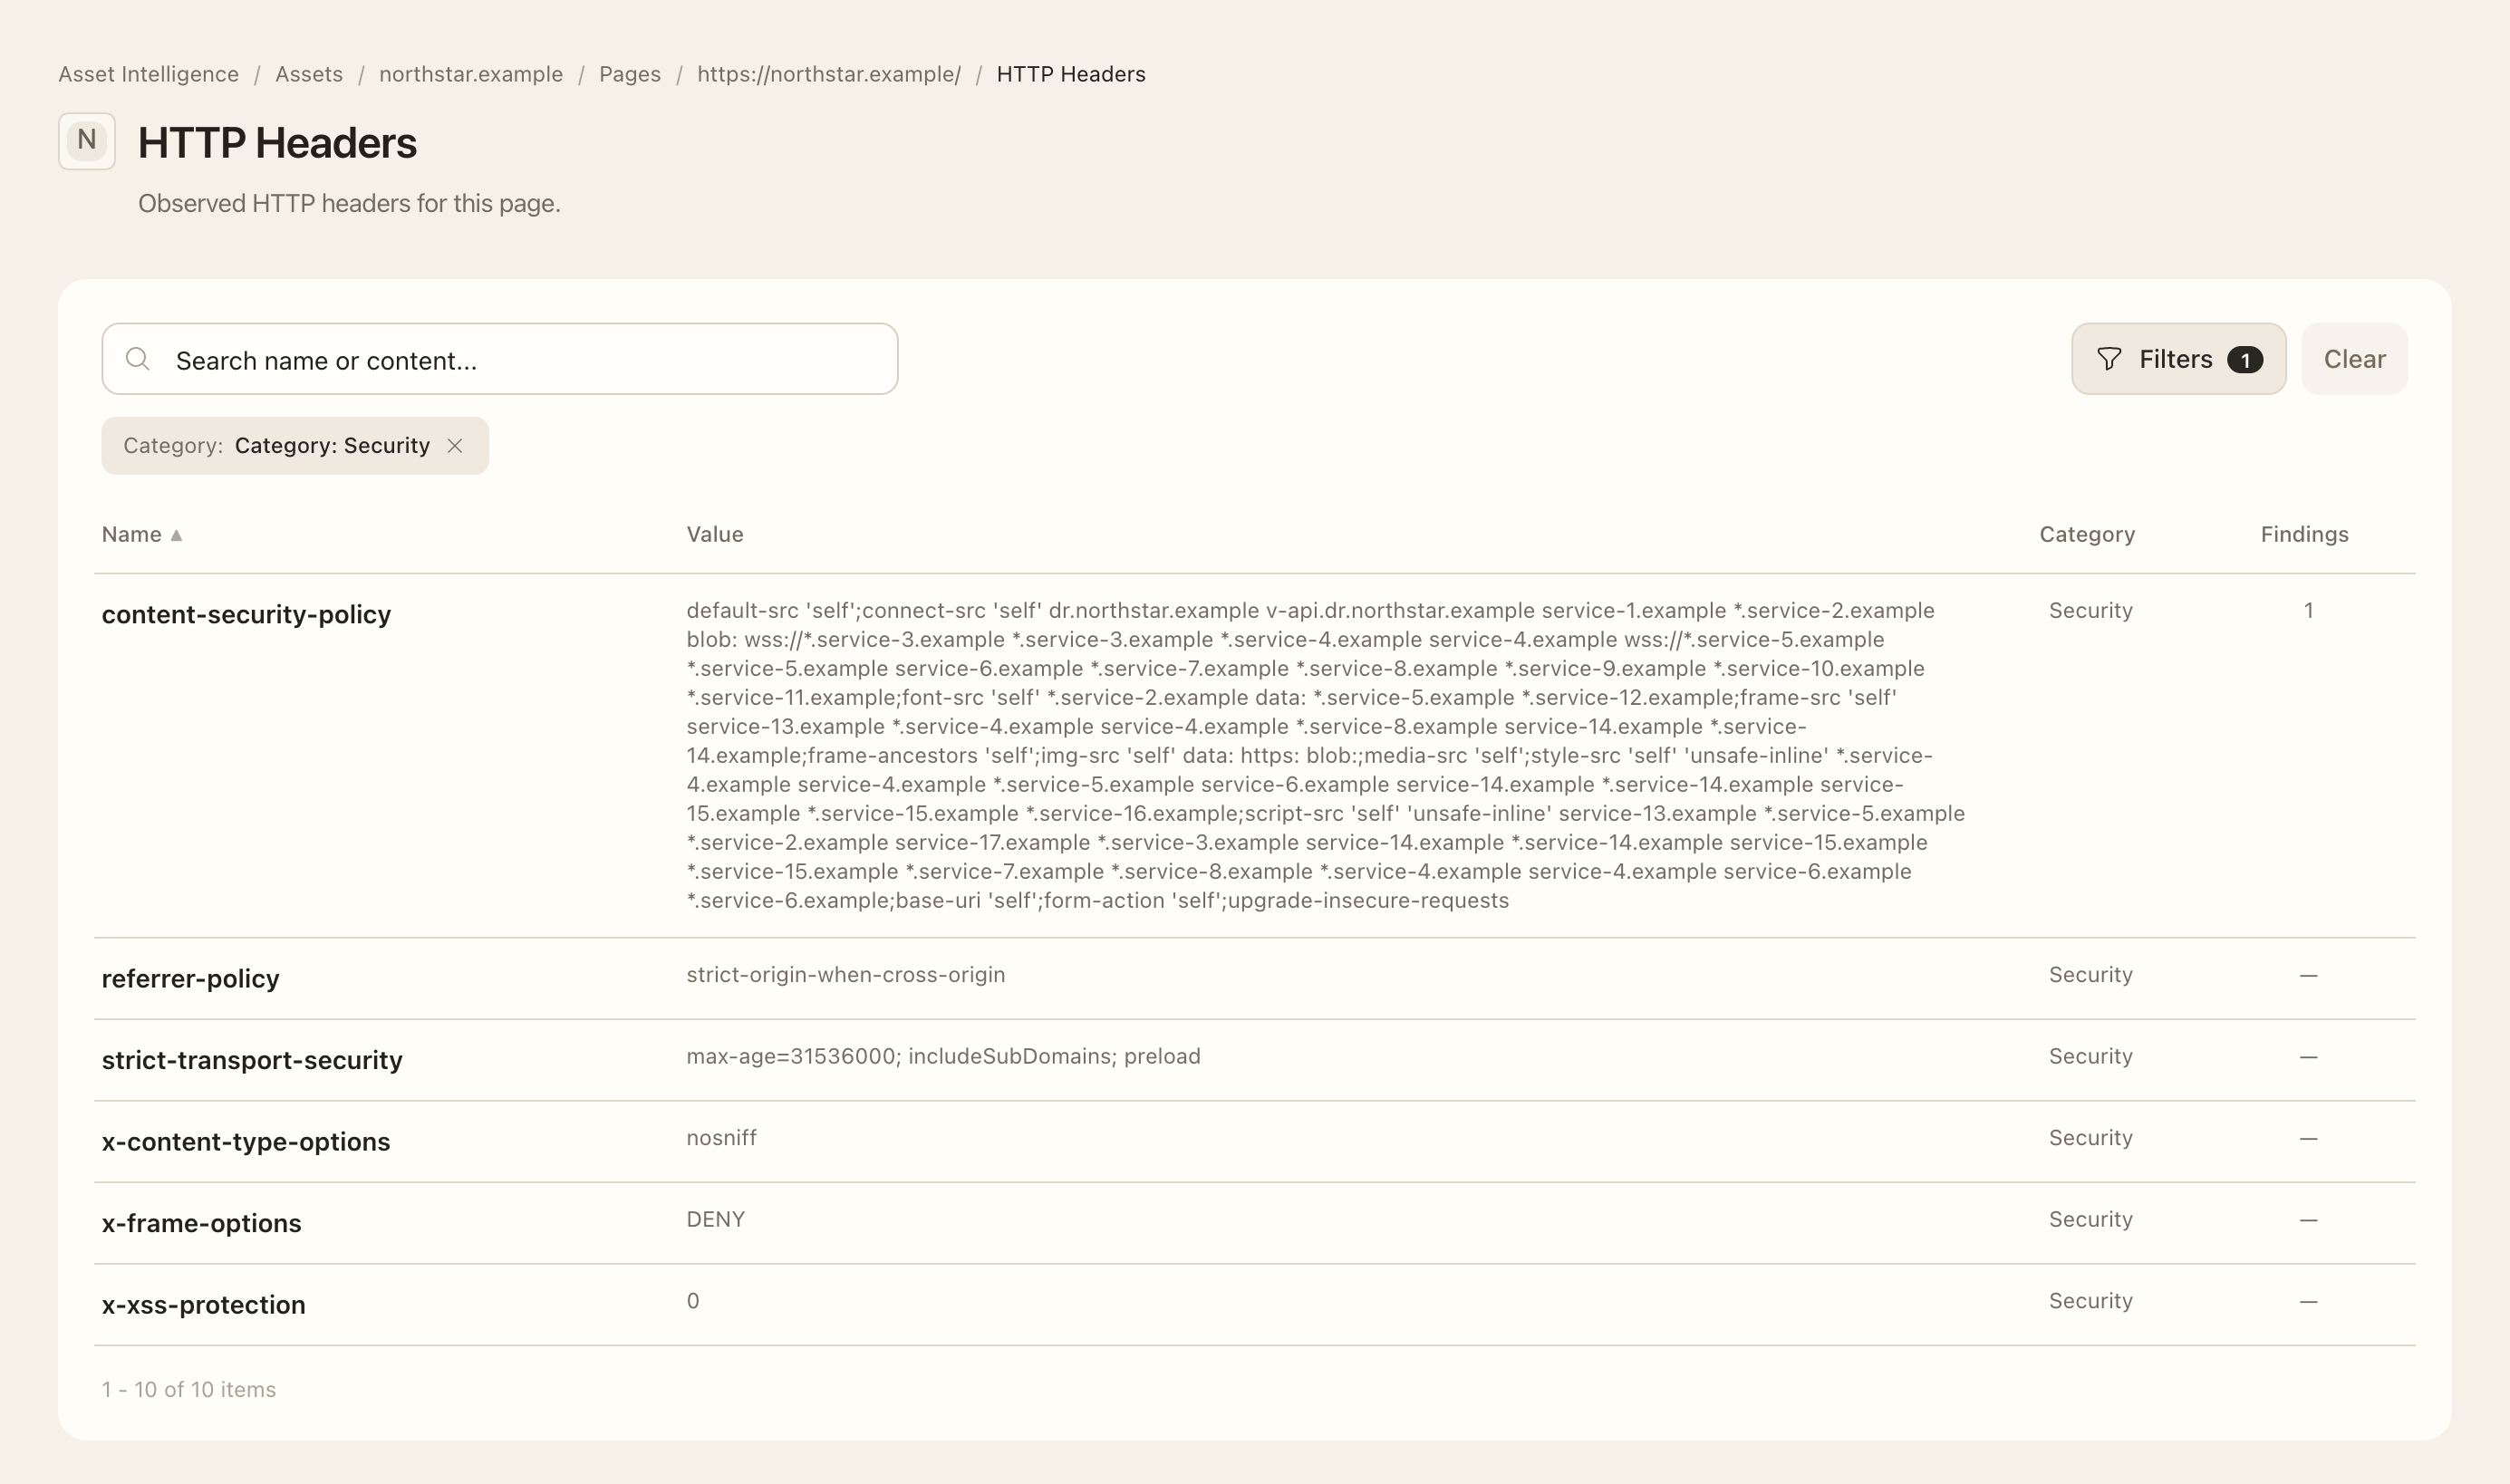
- Open HTTP Headers from the page.
- Locate the relevant header and inspect its full value and observed response context.
- Compare it with the intended redirect, caching, or security policy and follow any related finding for its assessed evidence.
Compare cookies around consent
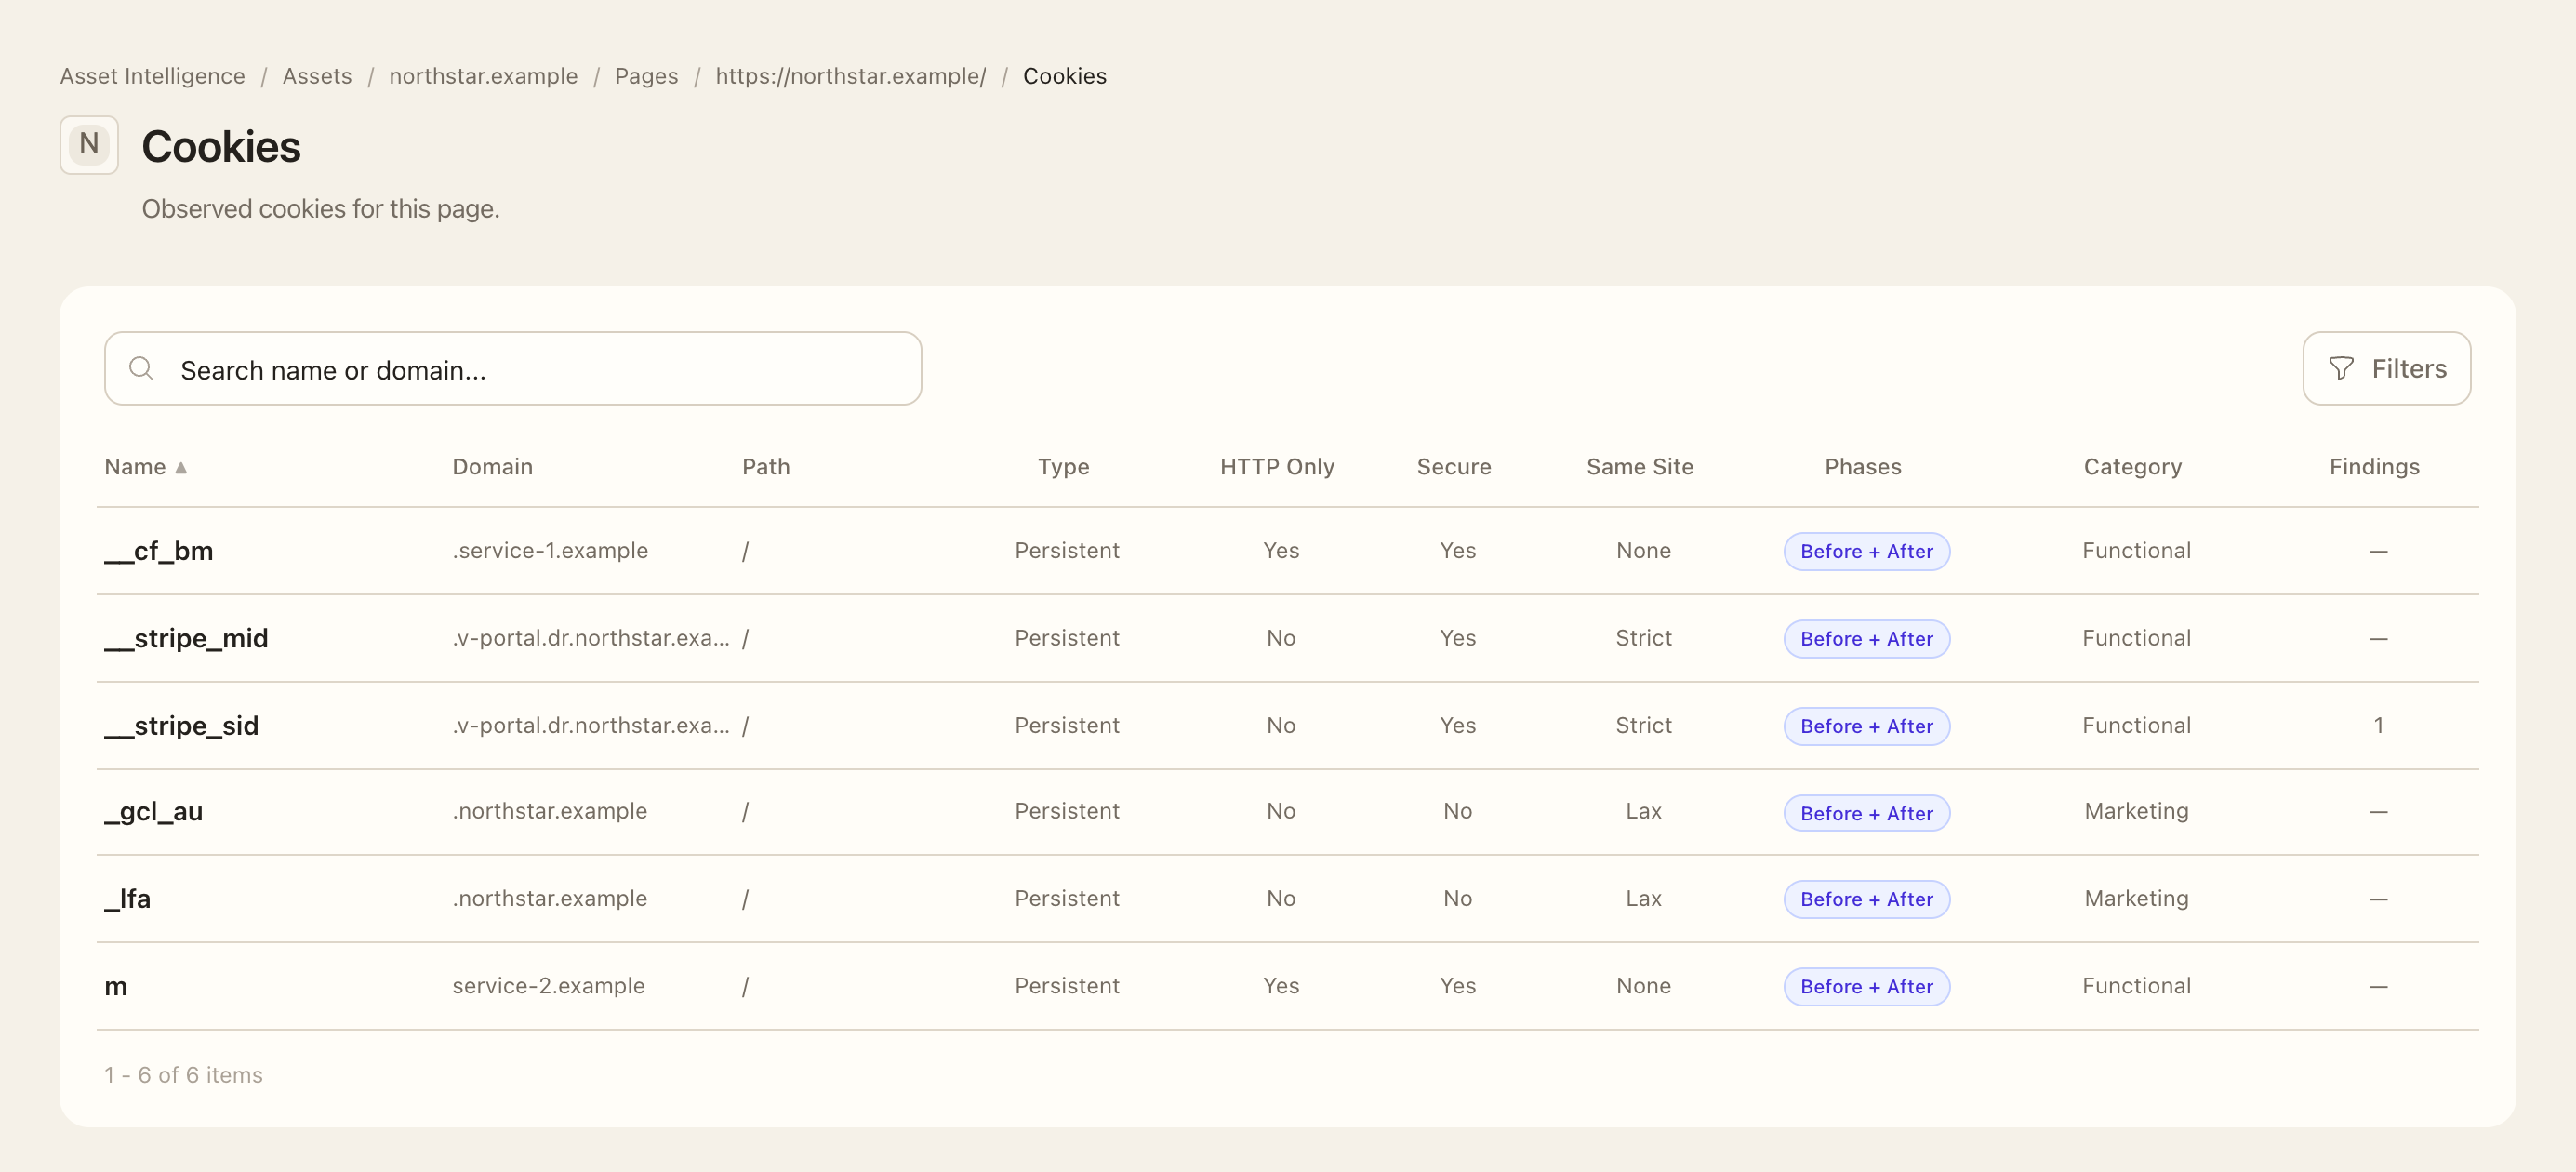
- Open Cookies and select the available capture phase.
- Inspect cookie name, domain, expiry, Secure, HttpOnly, SameSite, and available attribution.
- Compare before- and after-consent observations with the Consent Attempt result to see whether the banner interaction completed.
- Investigate the applicable cookie finding when a recorded configuration needs review.
Follow resources and runtime errors
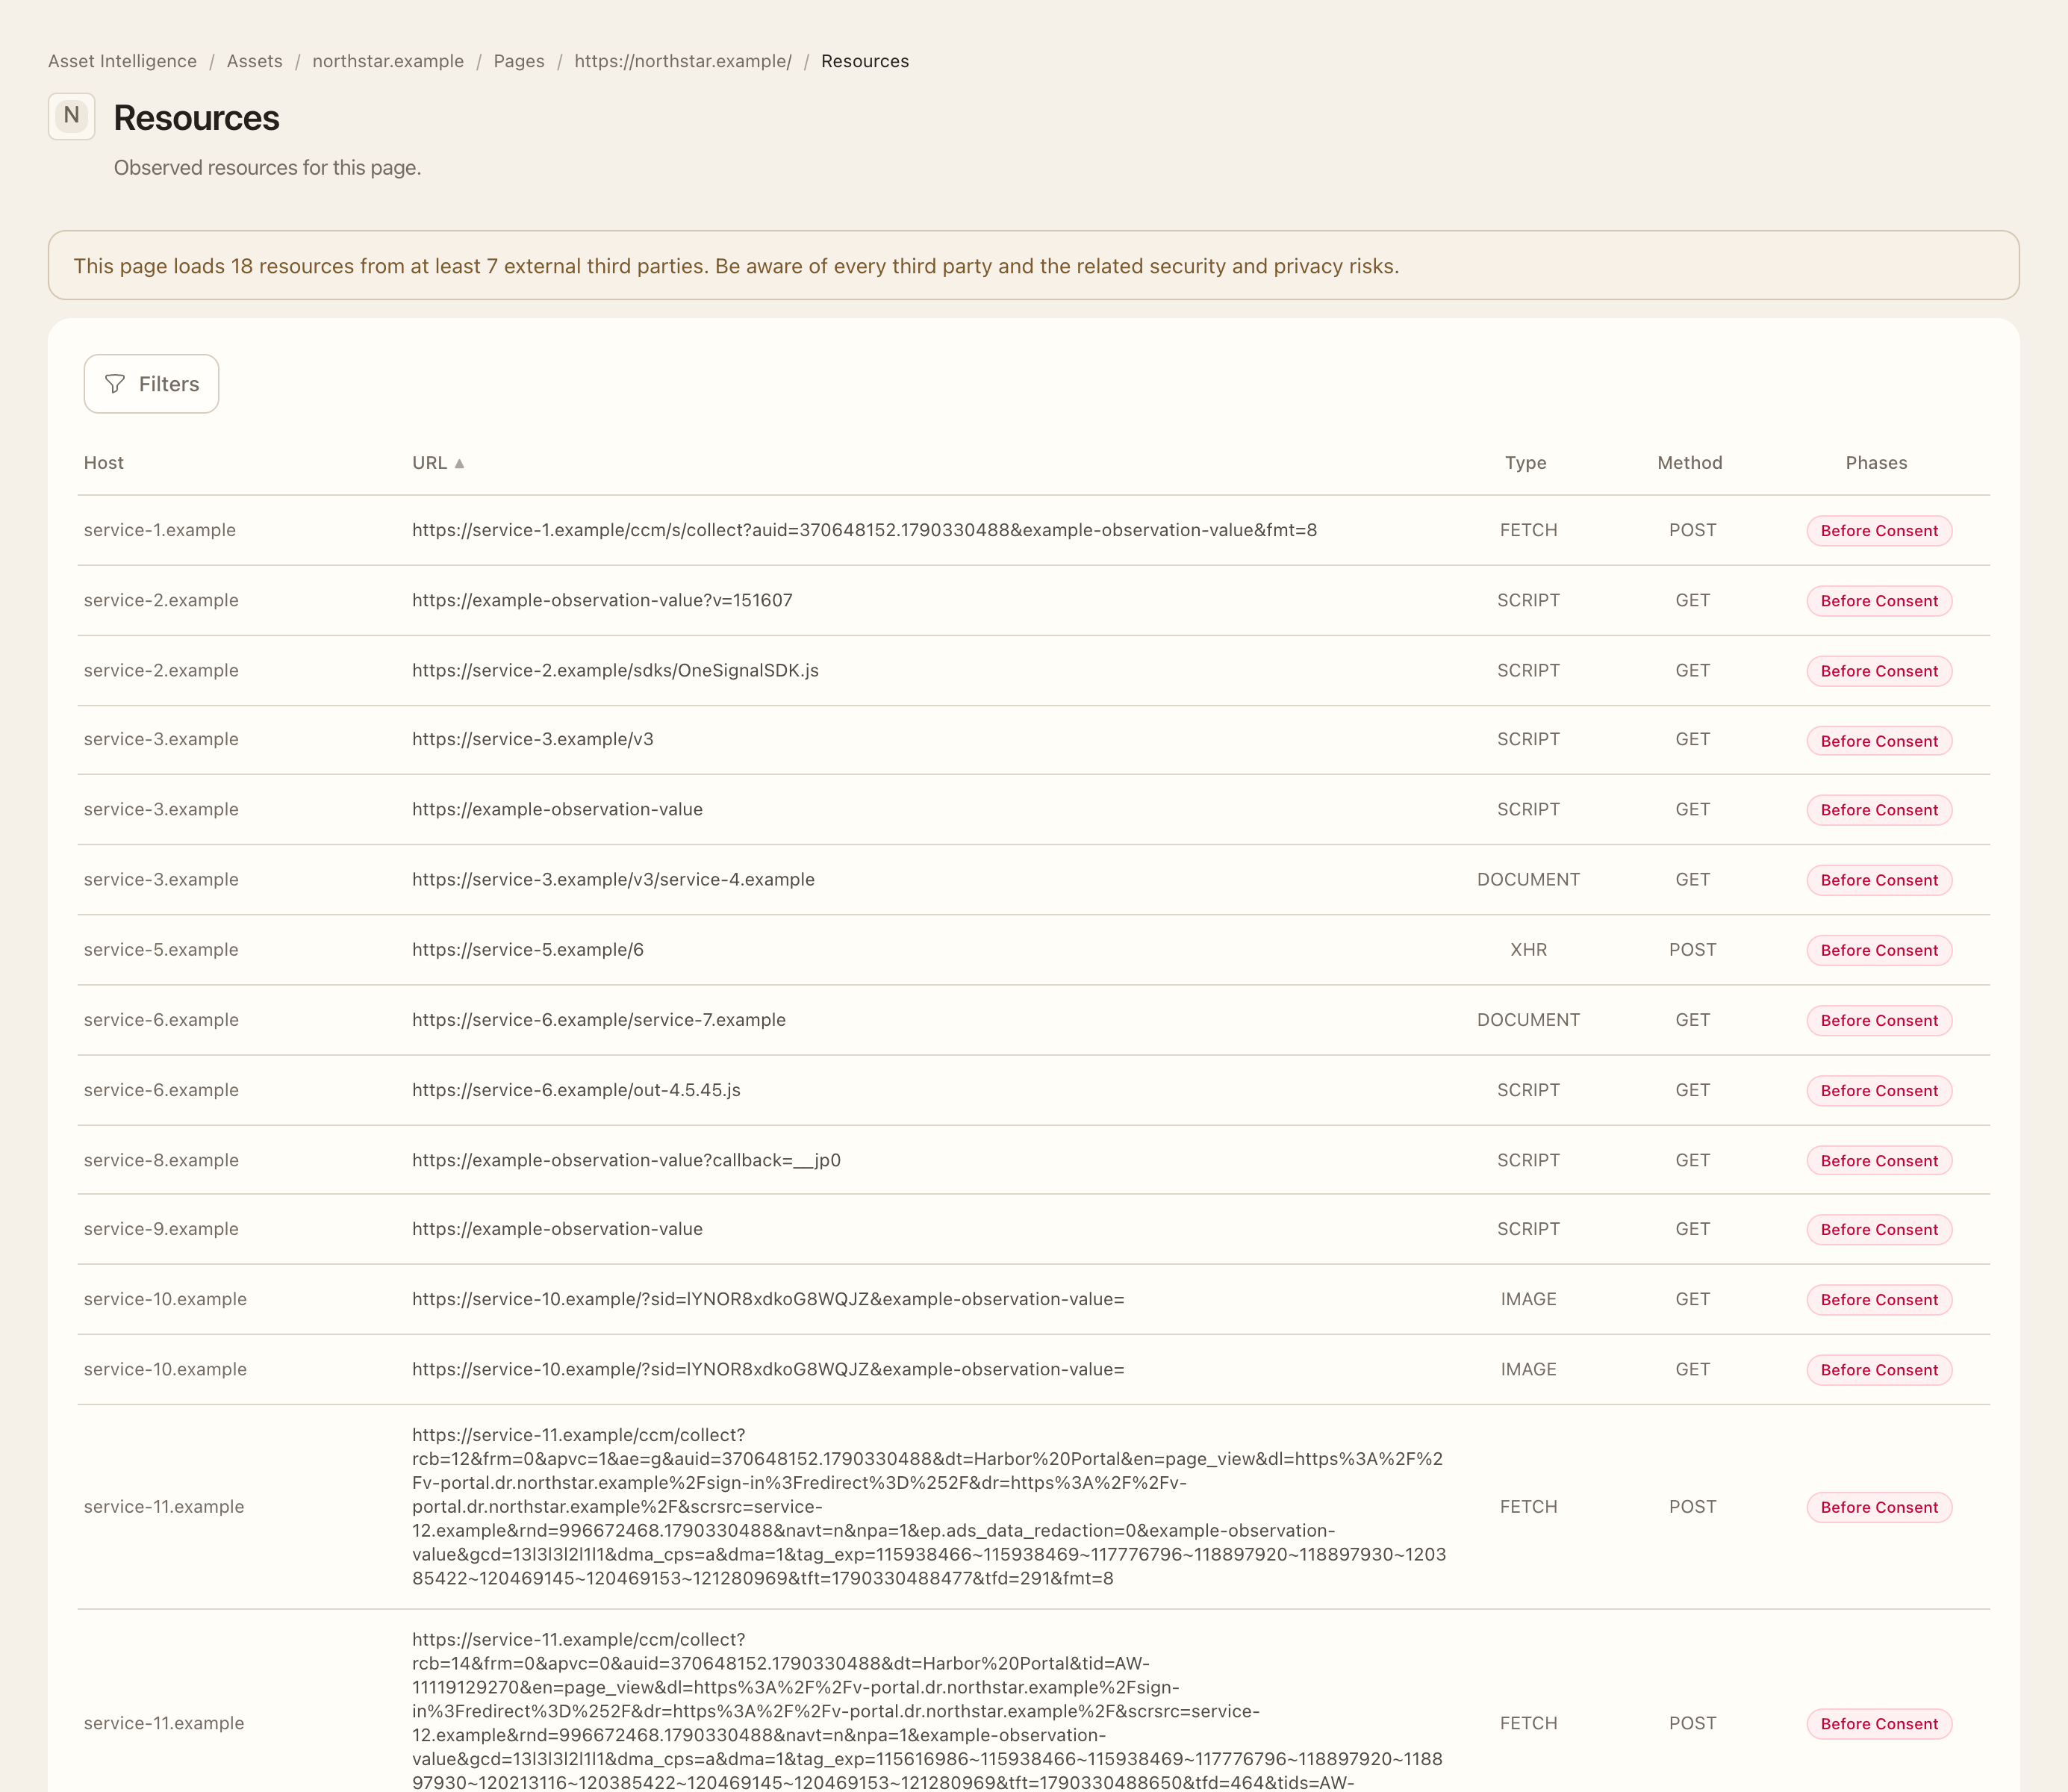
- Open Resources and use its available filters to inspect scripts, images, APIs, and other loaded dependencies.
- Open Console Logs to inspect observed warnings or errors. Check the affected URL and same-origin context before assigning the issue to your application.
- Compare related operational events for durable third-party service adoption or removal rather than treating every rotating resource URL as a new service.
- If a browser-storage credential finding is present, review its sanitized storage location, detector, phase, and value length, then investigate the source application through your normal remediation process.
Understand page services
Page services summarize durable third-party usage inferred from cookies, resources, and other runtime evidence. Use service-adoption or removal events to investigate a change in a page’s external service footprint. A rotating resource URL or cookie can change while the underlying service remains the same; recurring provider noise can be suppressed without removing the useful service signal.
Identify collection traffic
If a WAF or access control blocks collection
- Compare the observed URL, screenshot, and Monitoring limited state with the page you intended to monitor.
- If your WAF, bot protection, or source-IP restrictions block authorized monitoring, ask the responsible administrator to review the current Kantoku collection source IPs.
- Where required, permit those collection sources under your organization’s approved access policy, then inspect a later successful observation. Use the current published list rather than copying addresses from guide screenshots.
- For a protected custom page that needs sign-in, configure an authorized authentication profile rather than treating an allowlist as a substitute for application credentials.
A challenge page, blocked collection, or collector execution failure describes monitoring coverage. It is not itself a customer finding and does not lower the Exposure Score. Incomplete coverage does not confirm that an earlier finding was fixed.
Expected outcome
You can inspect the collected page evidence, its capture phase, and any coverage limitations.
Supported browser-storage checks inspect top-level same-origin localStorage and sessionStorage before and after the consent attempt. High-confidence matches can include authentication tokens, passwords, private keys, provider credentials, authorization credentials, and credential-bearing connection strings. Local storage persists beyond the current tab, so a local-storage match is treated as more severe than an otherwise equivalent session-storage match. Credential values, decoded tokens, and value hashes are not retained in finding evidence. Incomplete storage coverage does not resolve an existing finding. Cookie findings can group related evidence by page and service, and recurring tracker or challenge churn may be suppressed from events to reduce noise.