Asset Intelligence
Know what is exposed. Understand what changed. Act with context.
Continuously monitor domains, public IPs, services, and pages. Kantoku turns observations into a connected asset view, explainable score changes, prioritized findings, and the evidence behind them.
A living view of internet-facing reality
Inventories describe what should exist. Asset Intelligence shows what is observable now, how it connects, and how it has changed—so your team can spend less time assembling context and more time deciding what to do next.
01
Discover the surface
Bring domains, public IPs, subdomains, ports, pages, DNS records, certificates, and observed dependencies into one navigable asset view.
02
Prioritize the signal
Use Exposure Score history, severity, top priorities, and dispositions to focus review and preserve the reasoning behind decisions.
03
Inspect the evidence
Move from an asset summary to the page, service, header, technology, resource, or historical snapshot behind an observation.
Connected context
See the surface as a system
The Exposure Map shows observed relationships between an asset, its hosts, services, pages, and external resources. It gives investigations a useful starting point before anyone opens another tool or spreadsheet.
Drill into monitored ports, pages, DNS, certificates, subdomains, and reports without losing the asset-level picture.
One connected investigation path
1Domains & public IPs
2Hosts & services
3Pages & dependencies
4Evidence & history
Explainable prioritization
Know what deserves attention—and why
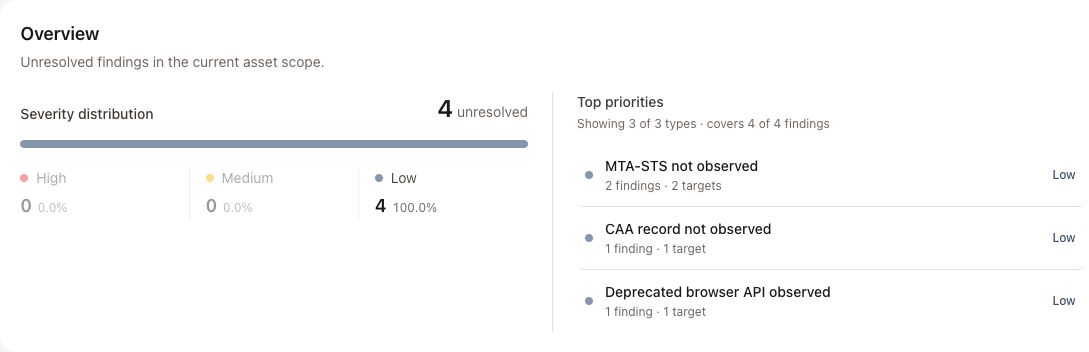
Findings separate actionable review from raw observation. See unresolved severity, recurring finding types, affected targets, and the priorities that are shaping the current Exposure Score.
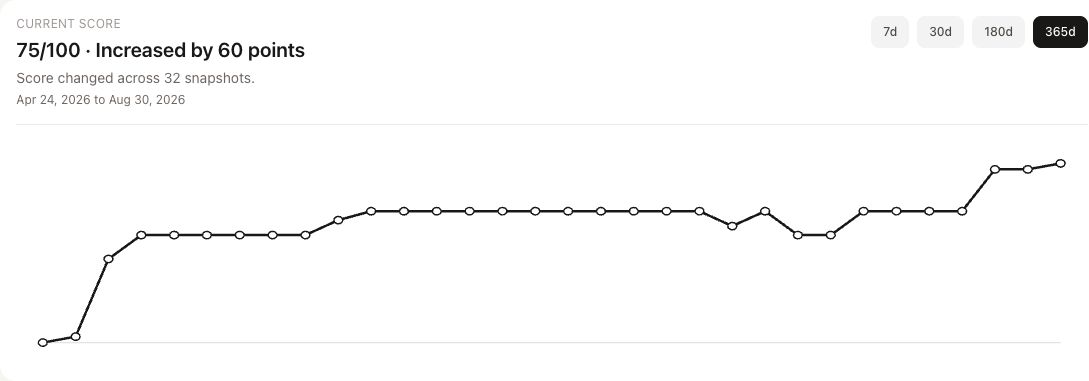
Score history makes posture changes visible across snapshots, while dispositions retain the human context behind accepted, resolved, or otherwise reviewed findings.
Evidence, not just alerts
Inspect what is actually being served
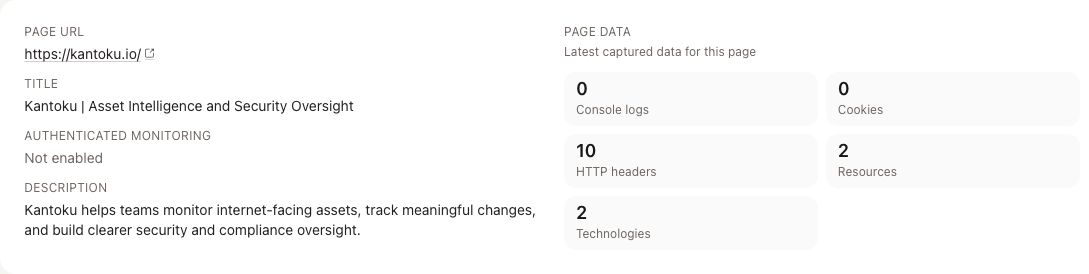
A page record keeps the observed URL, title, description, monitoring state, headers, cookies, resources, technologies, console logs, and redirect behavior together. Custom and authenticated page monitoring extends that evidence to important surfaces that discovery alone cannot fully cover.
Stay aware without turning every observation into an alert
Operational events explain what changed. Intelligence events surface related risks such as similar domains. Findings identify what deserves review. Keeping those concepts distinct makes the signal easier to understand and route.
Meaningful change
Review new or changed pages, services, DNS records, certificates, and lookalike domains in their asset context.
Flexible delivery
Filter notifications by finding severity or event priority, use immediate or digest email delivery, and send matching Slack findings immediately.
Build a current, evidence-backed view of your external assets
Create an account, start a free trial, and move from exposed surface to prioritized action in one workspace.
Go deeper in the docs
Explore the product model for assets, events and findings, similar domains, reporting, and the evidence collected by each monitor.
Explore Asset Intelligence documentation