Explore the Exposure Map
Trace hosts, services, pages, and dependencies.
Trace a relationship
- Open an asset and choose Exposure Map.
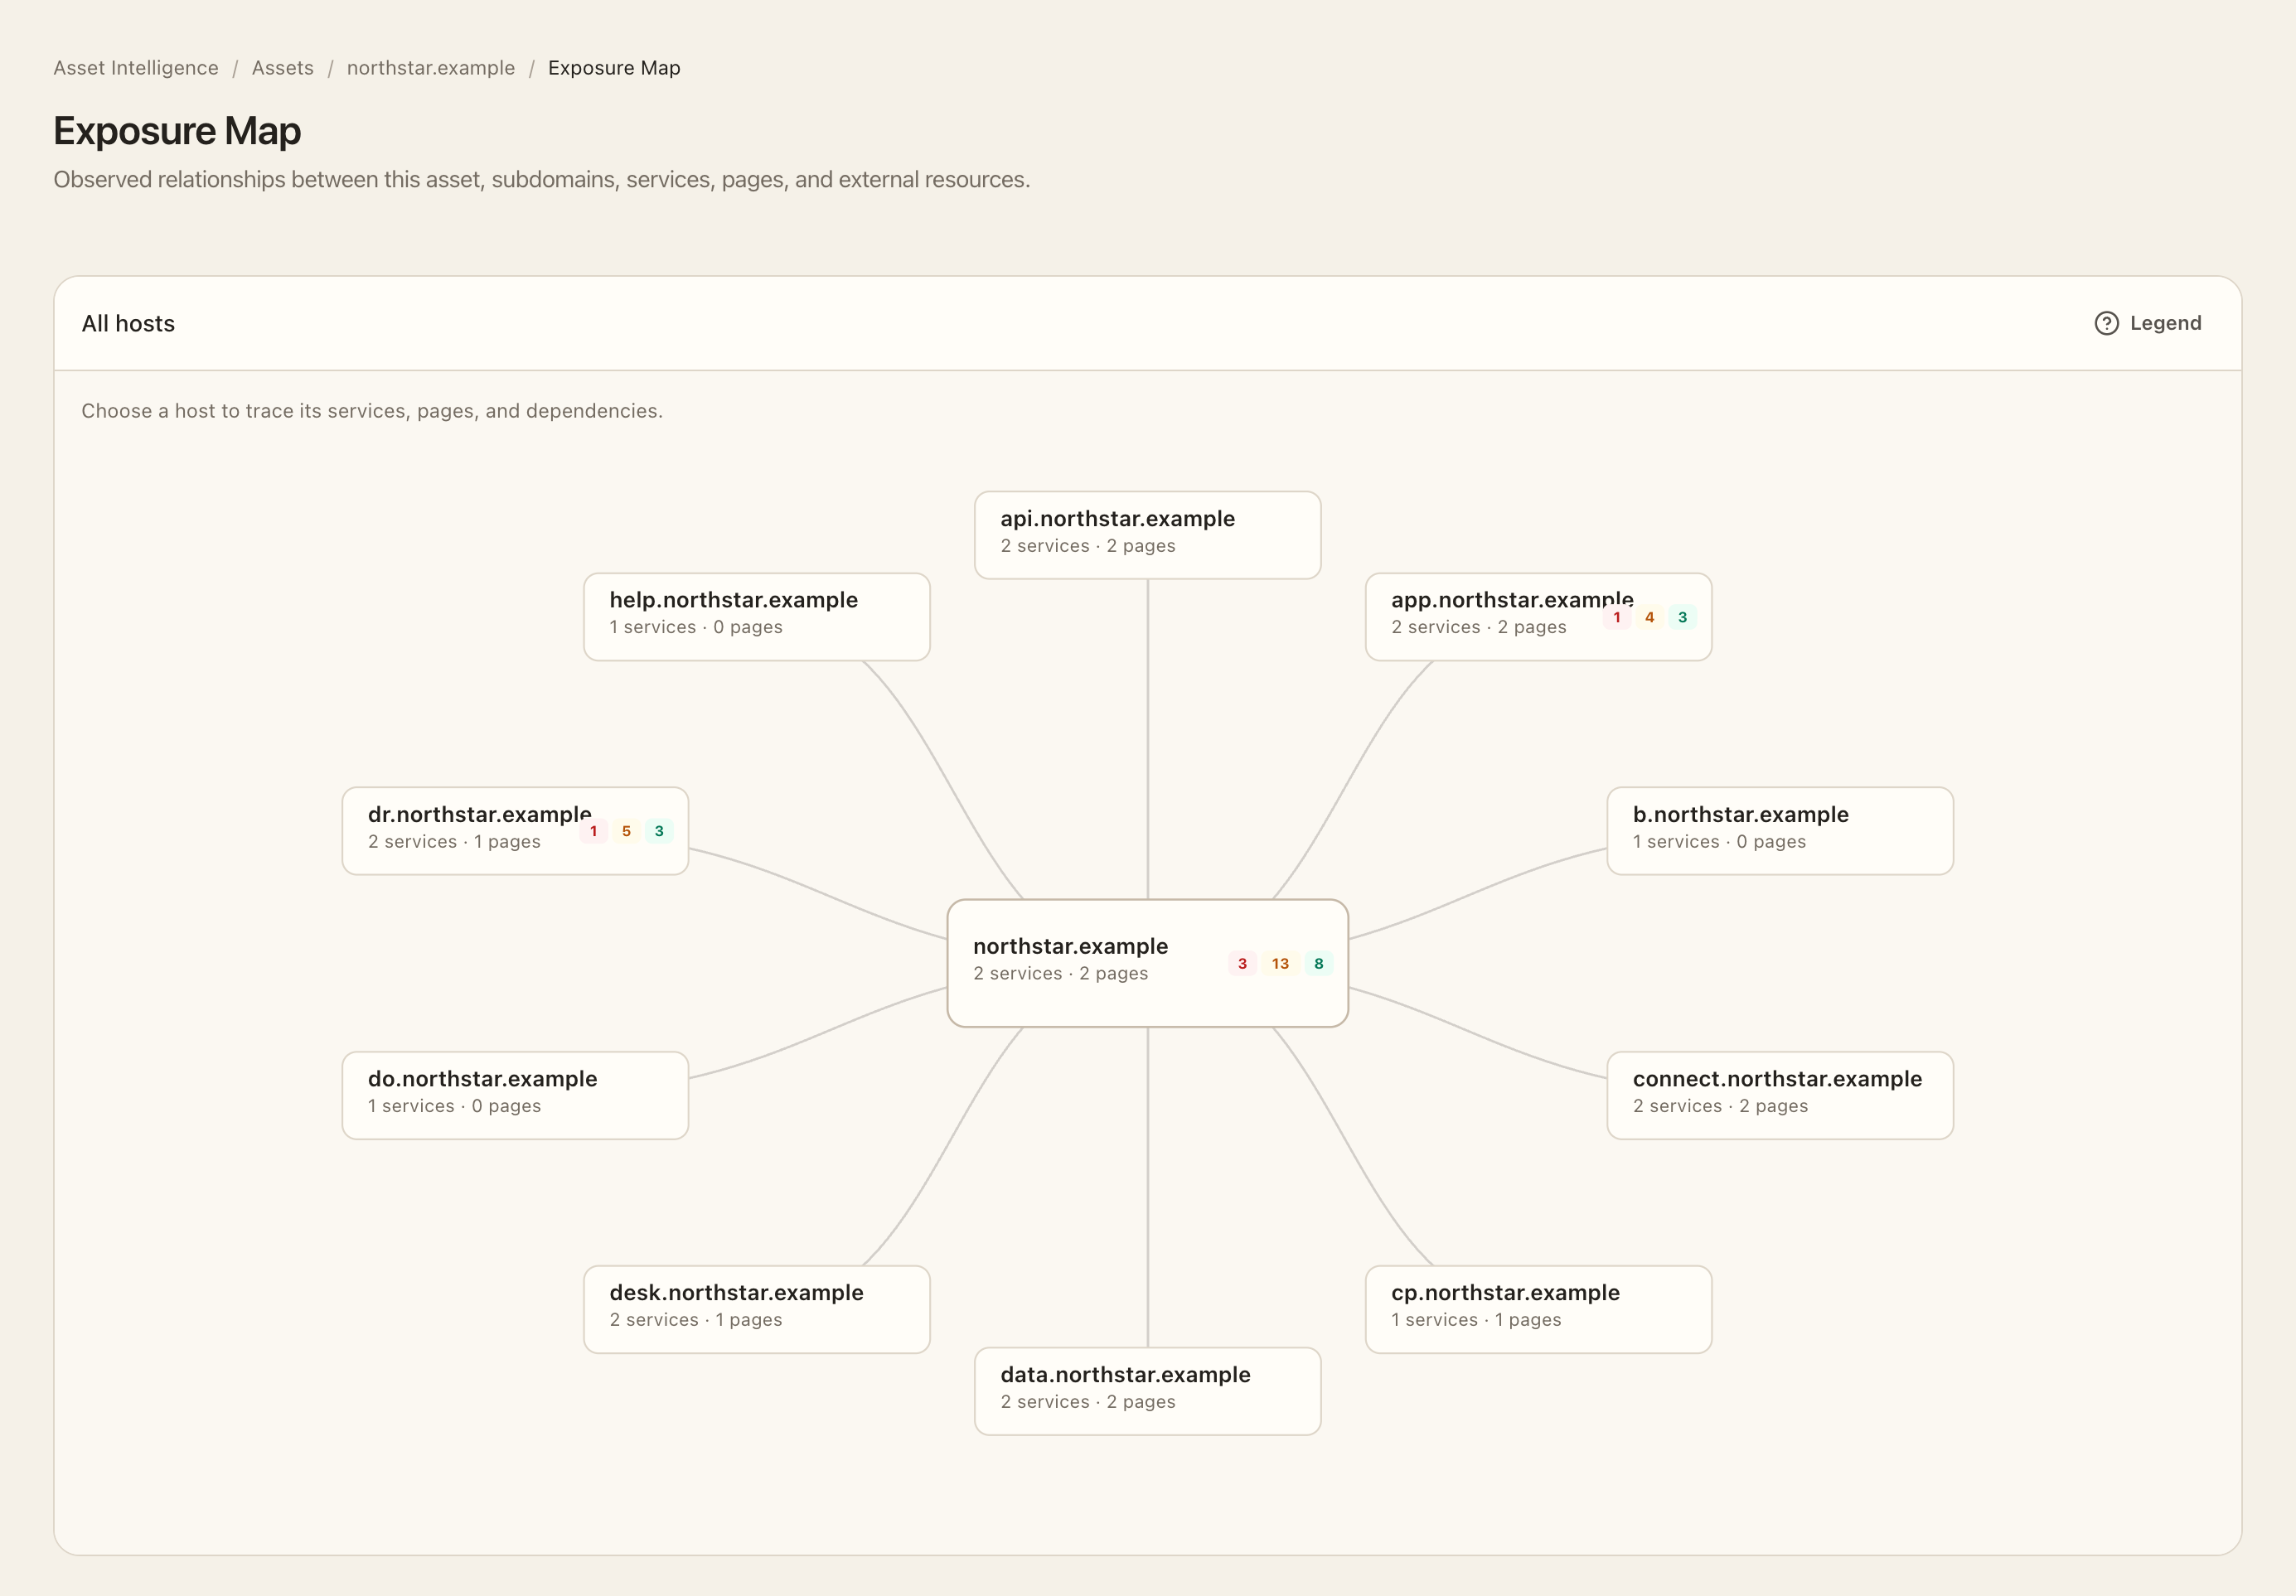
- Start with the asset-and-subdomain overview and select the host you want to inspect.
- Follow the focused left-to-right relationships between that host, its services, and monitored pages.
- Enable third-party dependencies when you need to inspect external relationships; keep them hidden when you want a simpler view.
- Select a leaf to inspect its contextual details and follow its detail link when available.
- Use the graph breadcrumbs to return to all hosts before choosing another branch.
Expected outcome
You can trace the observed route from an asset or subdomain to a service, page, and optional dependency. The map organizes existing evidence; it is not an editable architecture diagram or proof of complete dependency coverage.
If a page is missing
Check the target’s current open ports and page monitoring state. Historical pages on closed ports or pages no longer considered current may remain in history without appearing as current exposure.