Compare trends and snapshots
Investigate posture movement and changed observations within your history window.
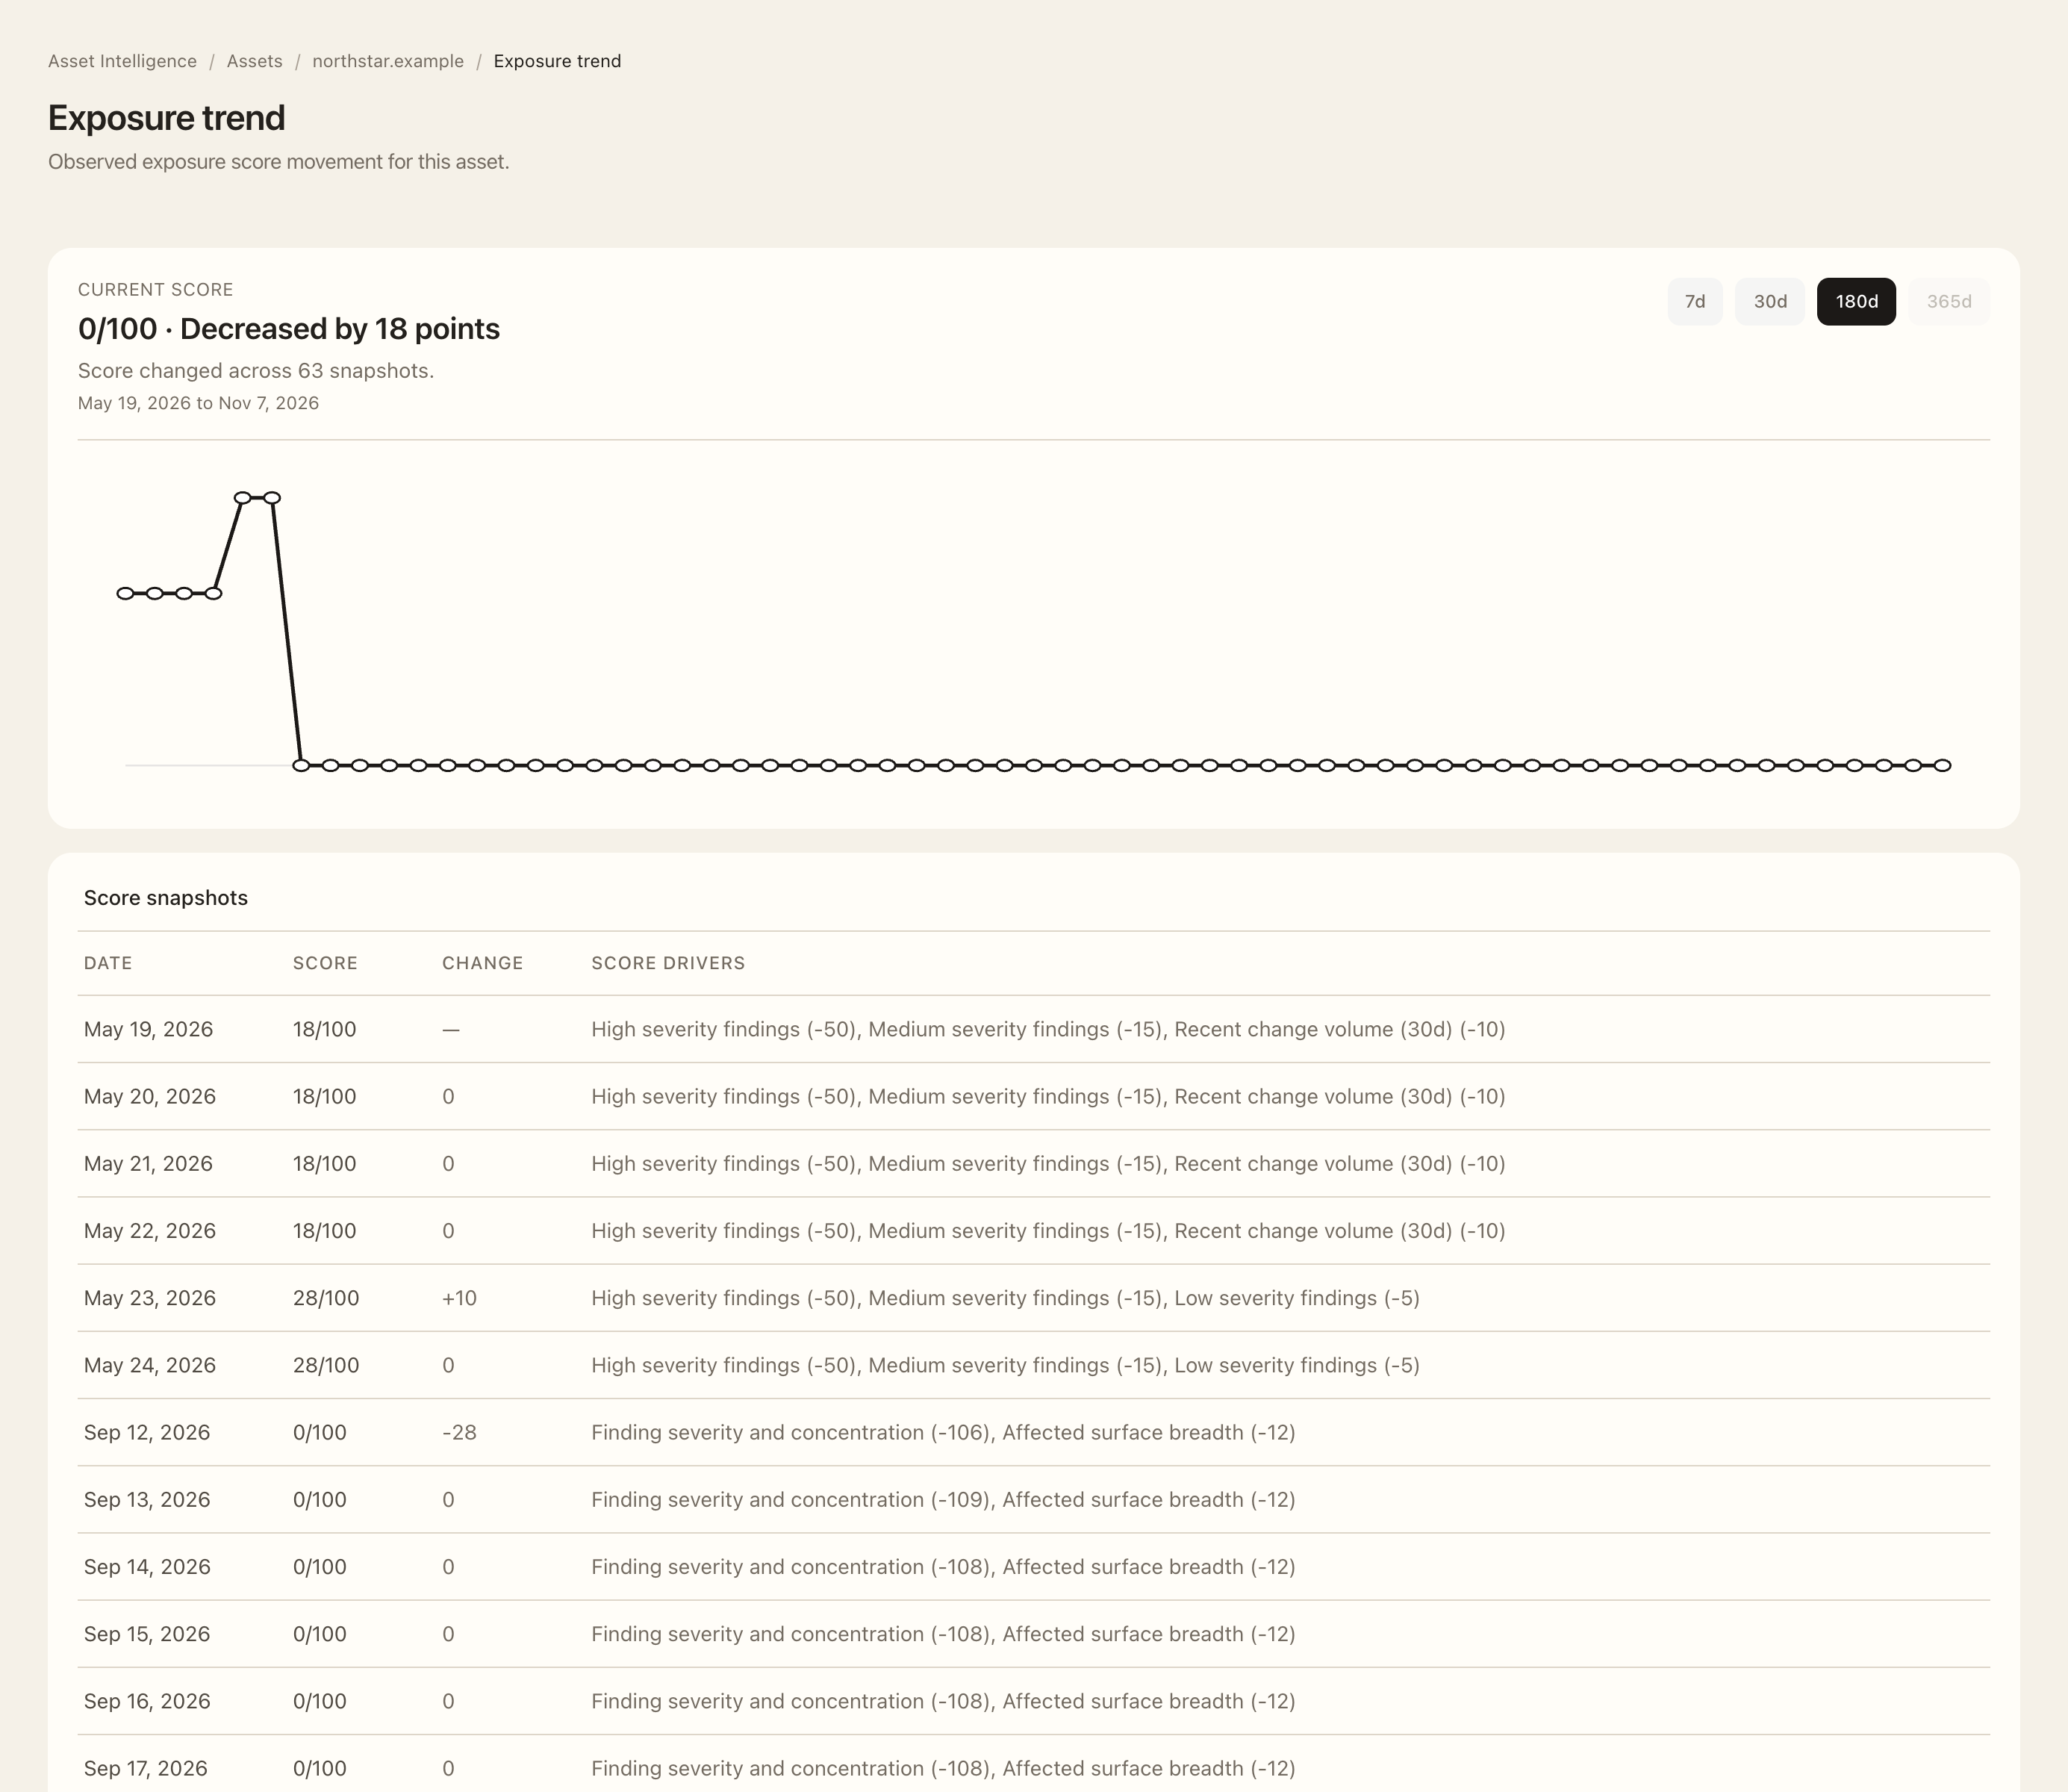
Review the exposure trend
- Open the asset overview and follow Exposure trend from its score history.
- Select an available time range. Longer ranges can be unavailable under your plan.
- Review the score movement and stored drivers for the dates involved.
- Return to the live overview to compare the latest recorded posture and current finding assessments.
Inspect snapshot history
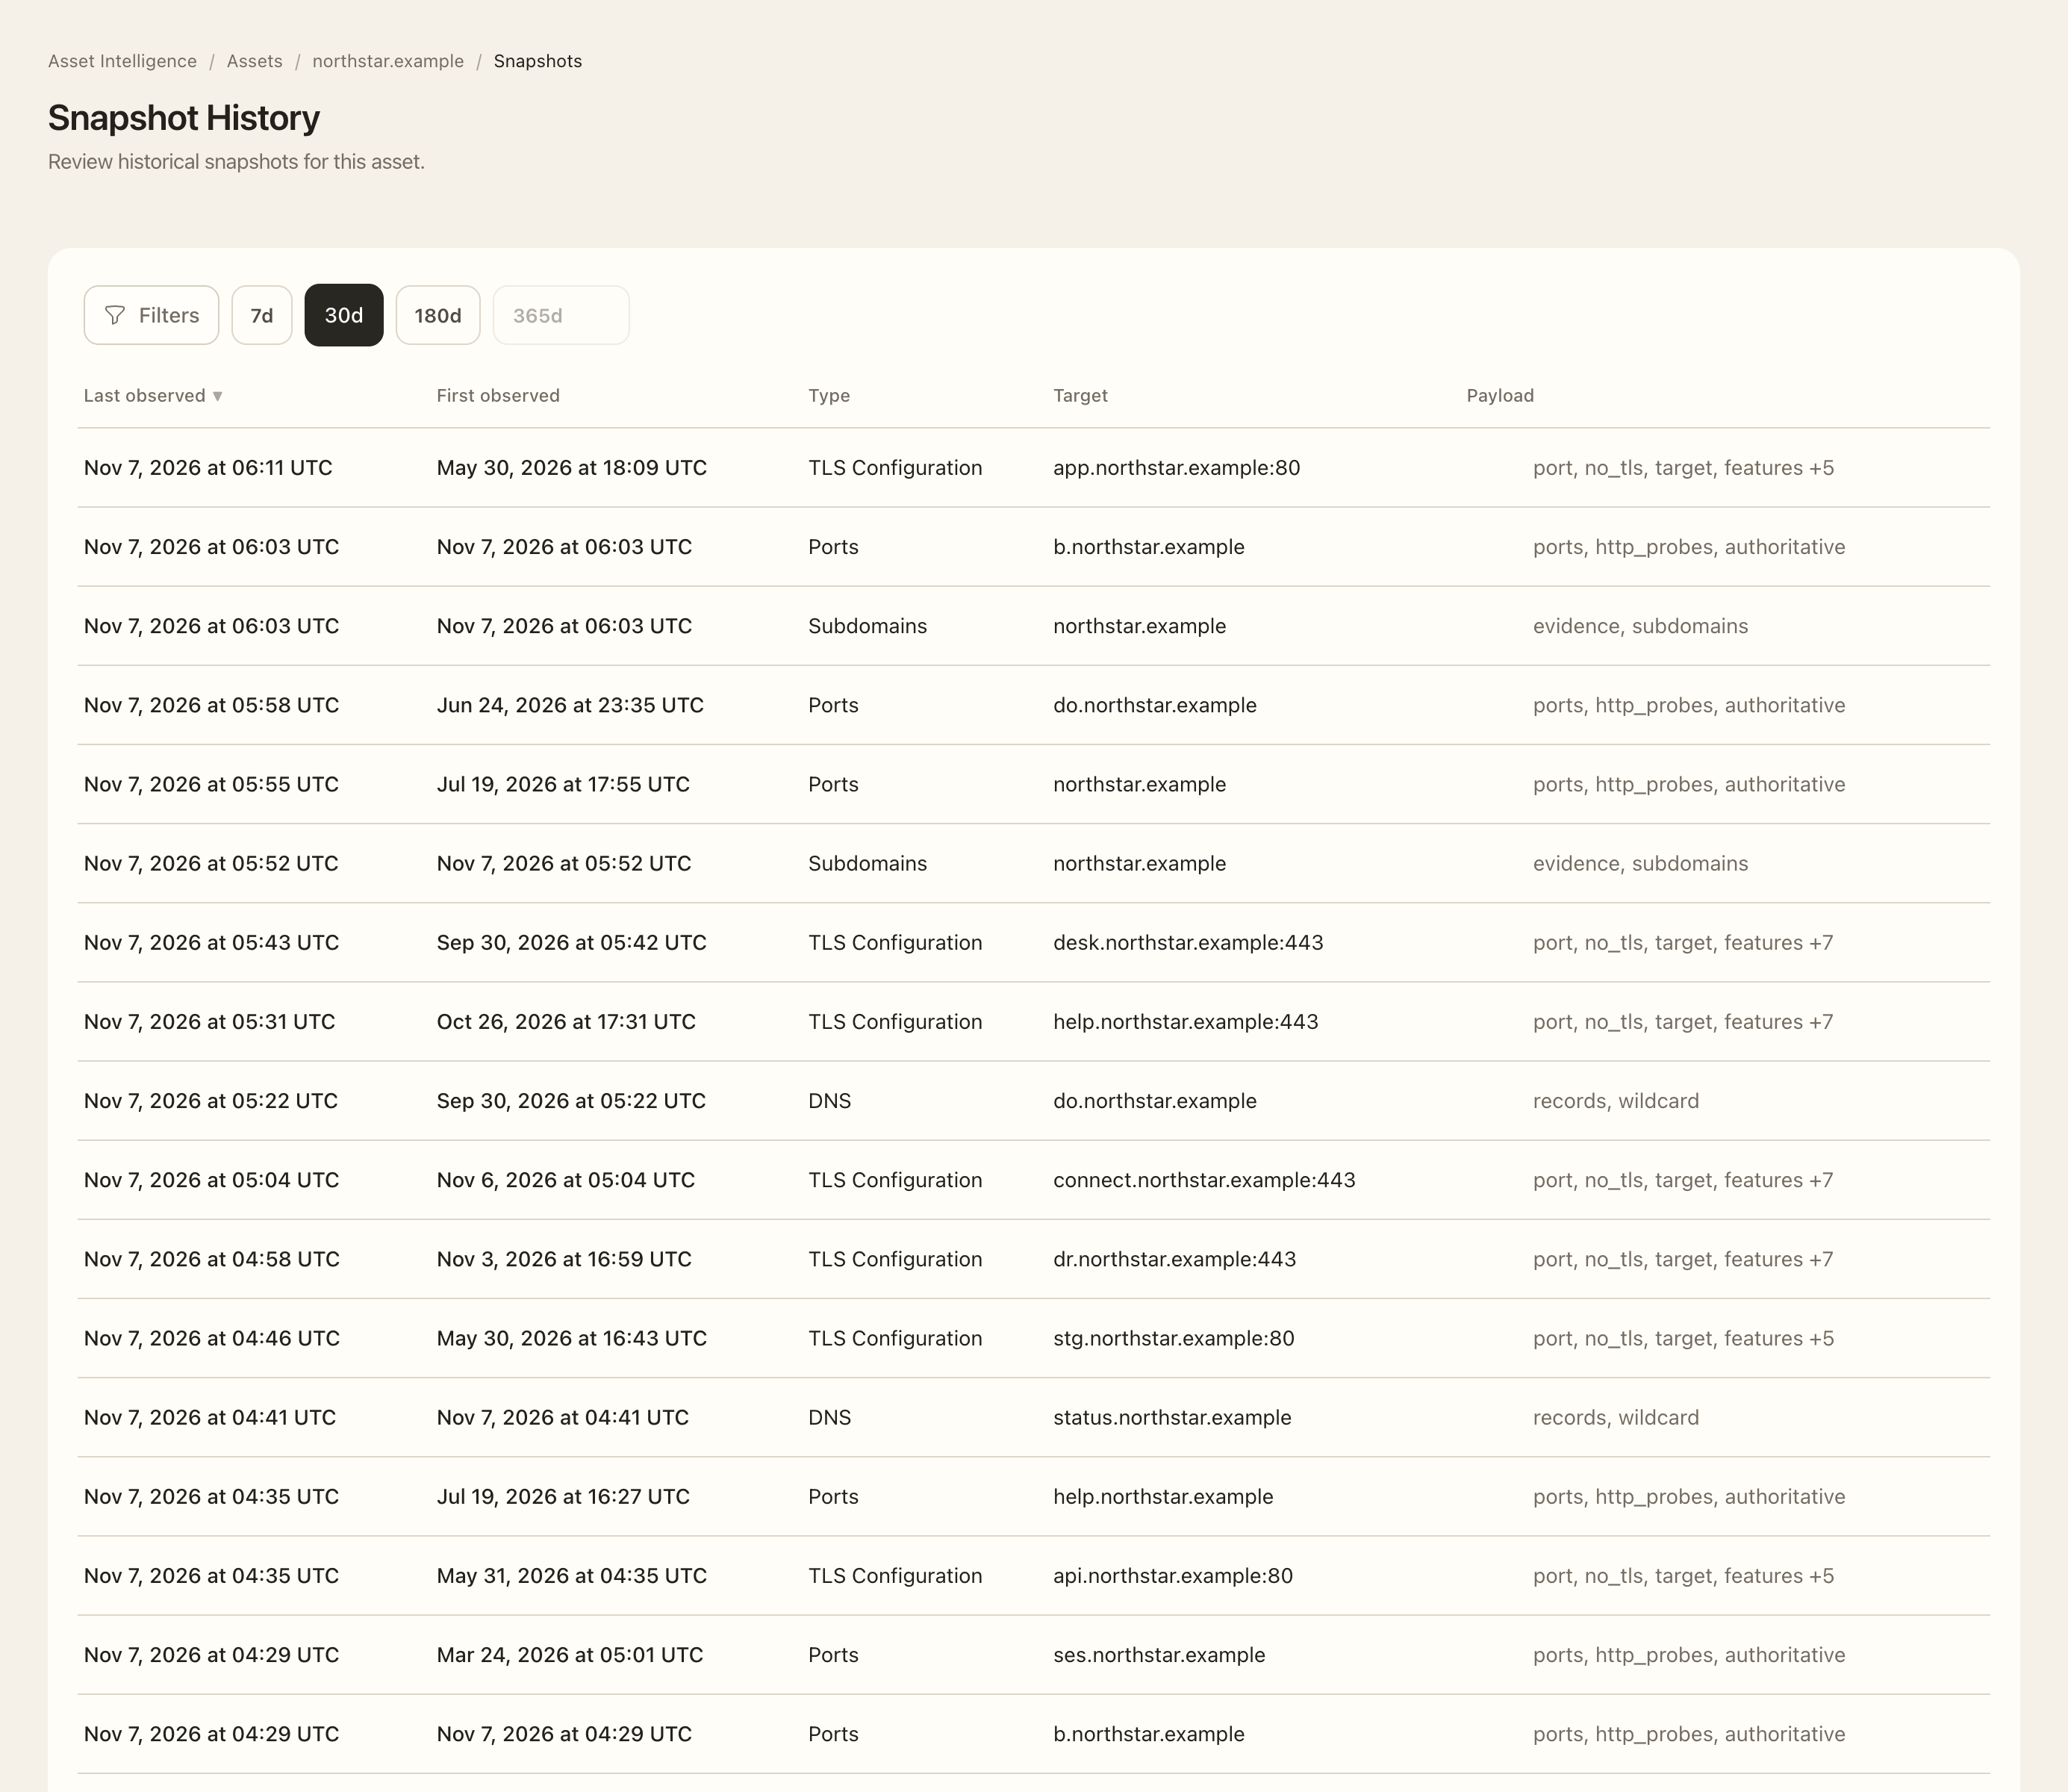
- Open Snapshots on the asset.
- Select a target, snapshot type, and available date range.
- Sort by observation time and expand the relevant changed state.
- Compare its recorded evidence and timestamps with the related event or finding.
- Clear the filters to check whether the apparent gap came from your selection.
Expected outcome
You can distinguish score movement from changes in the underlying observation. Identical observations update Last observed instead of creating duplicate snapshot rows. A sparse change history does not necessarily mean monitoring stopped.
History depth depends on the current plan. Timestamps use your profile timezone. Incomplete or failed collection is not evidence that an earlier issue has disappeared; check the latest successful observation.