Understand the evidence
Read an asset in context
- Open Assets and select the domain or public IP address you want to review.
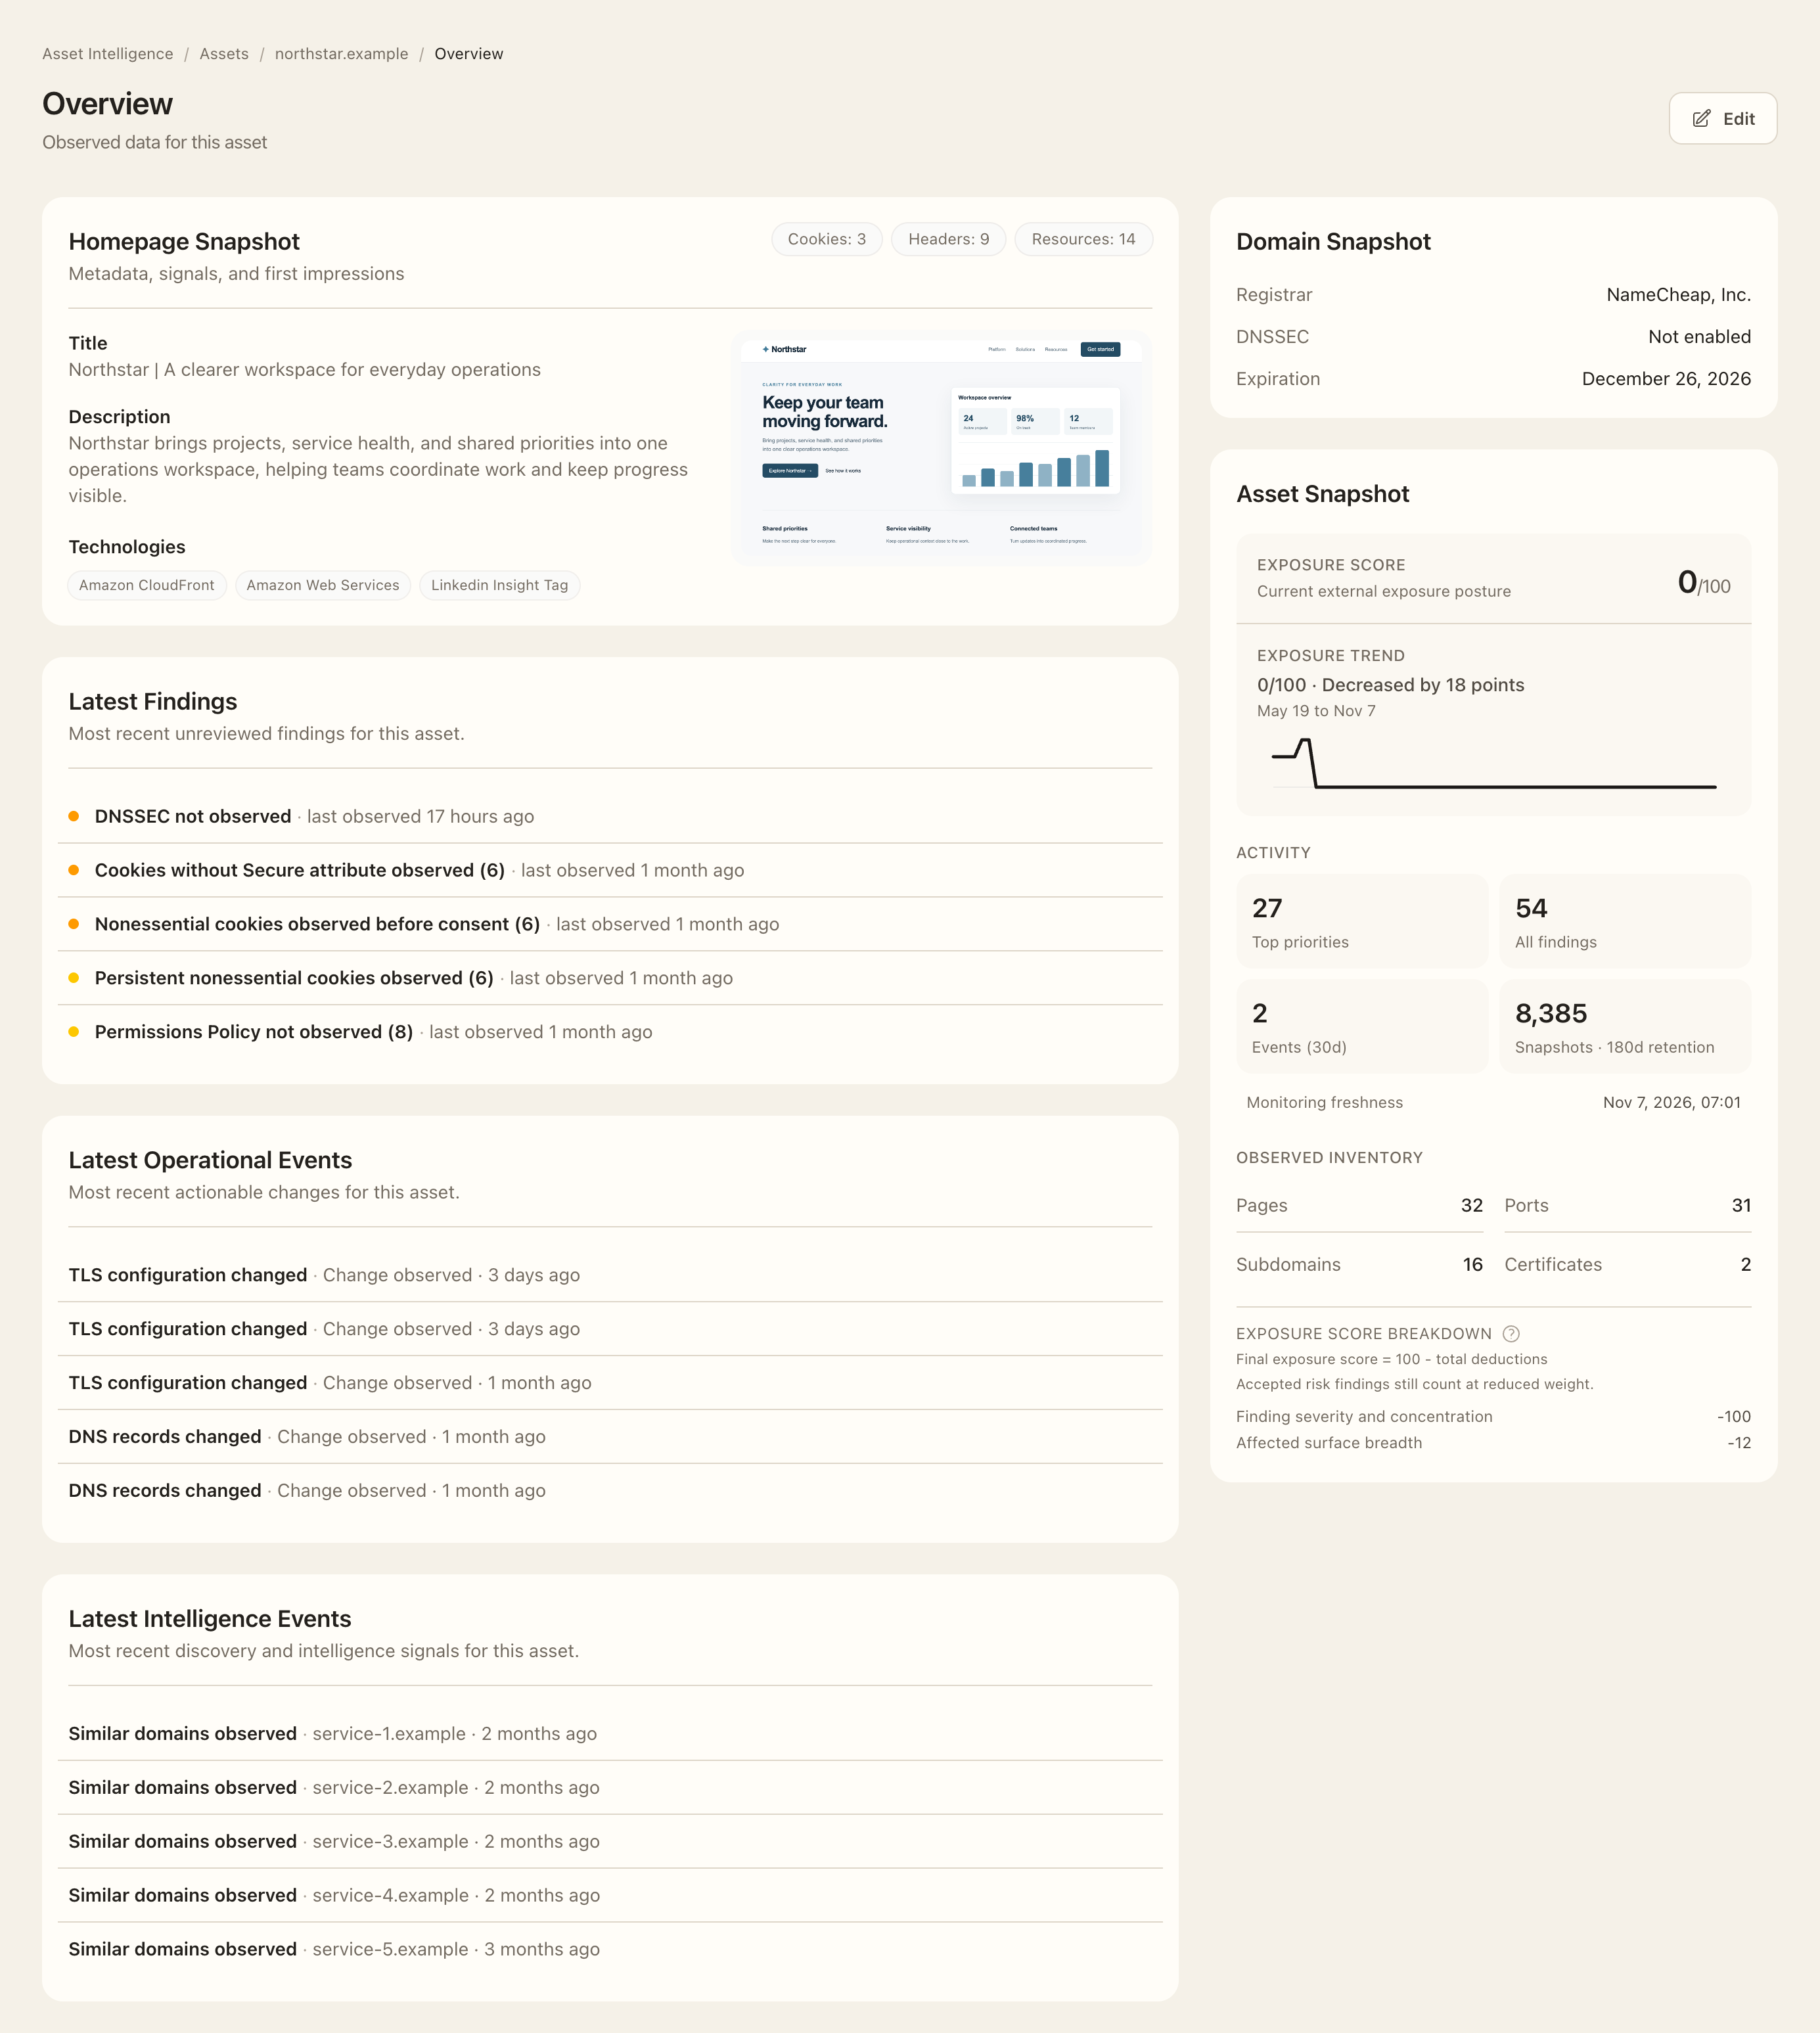
- Check the overview’s observation times and monitoring freshness before interpreting its summaries.
- Open a current inventory such as Ports, Pages, DNS Records, or Certificates for the recorded facts.
- Open Events when you need to understand a recorded change and its chronology.
- Open Findings when an evaluated condition needs investigation or an assessment decision.
- Compare the target and timestamps across these views before deciding what to do next.
What the records mean
- Asset: a monitored root domain or public IP defining the main scope. Discovered subdomains and related surfaces remain connected to that scope.
- Observation: facts collected about a target at a recorded time, such as DNS records, open ports, TLS configuration, or browser behavior.
- Snapshot: a retained changed observation state. Repeated identical observations can update the last-observed time without adding another history row.
- Page: a web surface identified by target, port, scheme, and path. A default or redirect-derived page differs from an explicitly configured custom page.
- Event: a normalized record of meaningful observed change. Operational changes and intelligence discoveries have different streams.
- Finding: an evaluated condition with severity, evidence, guidance, and active/resolved state. Your organization’s assessment is retained separately.
- Exposure Score: a summary of recorded technical posture and its drivers. It is not a certification or proof that every surface has been observed.
Check what collection could see
DNS, TLS, HTTP, screenshots, technology detection, and browser-runtime collection observe different evidence and may have different latest-success times. A page can look unchanged while its headers, cookies, resources, or technologies change.
Browser evidence distinguishes before- and after-consent phases. Consent Attempt shows the interaction result. Monitoring limited identifies pages where an access-control or challenge screen limited collection.
Freshness and coverage indicate which observations are current. Findings retain their monitoring state when collection is incomplete.
Read change in context
Compare a change with the known baseline and intended configuration. A long-standing open port and a newly exposed port may show the same current state but need different follow-up. Likewise, a disappeared record or service can matter when it changes expected ownership, trust, or exposure. Use event chronology and the last successful observation to distinguish continuity, drift, a new condition, and confirmed resolution.
Collection coverage and frequency
Asset Intelligence does not use one universal refresh interval for every signal. Collection cadence depends on both the plan and the type of evidence being collected.
The table below summarizes typical collection cadence by plan. Check Asset Intelligence plans for the current allowances and retention windows:
| Signal | Starter | Growth | Scale |
|---|---|---|---|
| DNS | Daily | Every 12 hours | Every 6 hours |
| Certificates | Continuous | Continuous | Continuous |
| TLS | Daily | Every 12 hours | Every 6 hours |
| TCP ports | Top 100 daily | Top 1,000 every 12 hours | Top 1,000 every 6 hours; full range within 7 days |
| HTTP ports | Daily | Every 12 hours | Every 6 hours |
| Web discovery | Daily | Every 12 hours | Every 6 hours |
| Browser capture | Daily | Every 12 hours | Every 6 hours |
| Technology detection | Daily | Every 12 hours | Every 6 hours |
| RDAP | Daily | Daily | Daily |
| Newly registered domain checks | Daily | Daily | Daily |
| Favicon | Daily | Daily | Daily |
| Screenshot | Daily | Daily | Daily |
In practice, this means higher plans refresh the core surface more frequently, while some supporting evidence remains on a daily cadence across all plans.
For Scale, full TCP coverage is spread across seven daily scan groups. The frequently used Top 1,000 ports are checked every six hours, while one part of the remaining TCP range is checked each day.
Certificate discovery includes continuous Certificate Transparency log monitoring, with scheduled backfill and reconciliation work used to keep certificate history complete.
Use this as a practical guide to how often new observations are usually revisited, not as a point-in-time processing guarantee.
Expected outcome
You can identify which view supports a fact, change, or assessment, and explain the time and coverage boundaries of that evidence. Use Trends and snapshots for history, Findings for triage, and Page evidence for runtime interpretation.